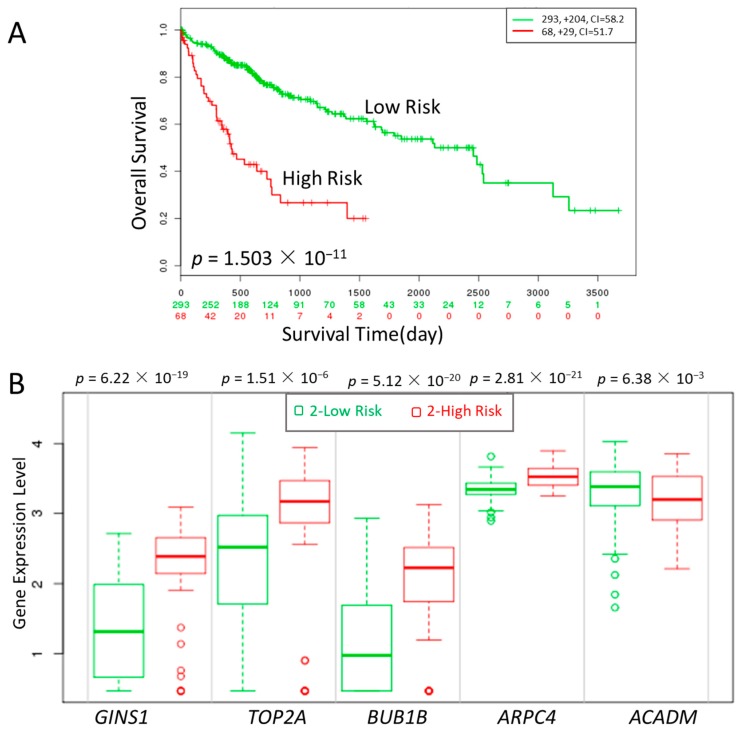
Figure 6.
Kaplan-Meier curves of gene groups (GINS1, TOP2A, BUB1B, ARPC4, ACADM) in The Cancer Genome Atlas (TCGA) liver cancer dataset based on SurvExpress (n = 381). “+” marks on the upper figure represents censoring samples. Horizontal axis represents time (day) to event. Outcome event, time scale, concordance index (CI) and p value of the log-rank test are shown. Red and green curves represent High- and Low-risk groups, respectively. The number below the horizontal axis represents the number of individuals not presenting the event of the corresponding risk groups over time. (A) The xpression of five genes is correlated with high risk, poor prognosis and shorter overall survival time. (B) box plot of the five genes across risk groups with the p value.

