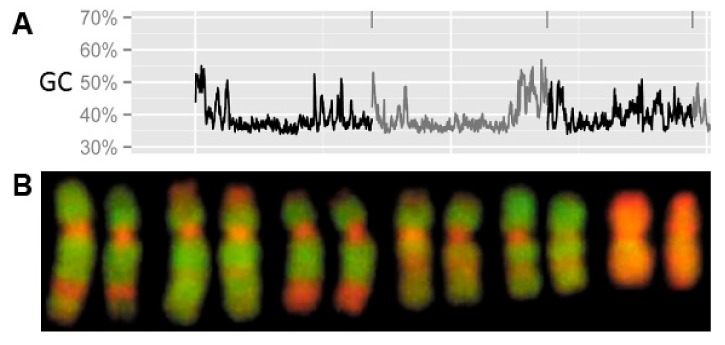
Figure 2.
(A) GC-profiles across three linkage groups (LGs) so far unassigned to their corresponding chromosome pairs showing fluctuations in GC-percentage produced using the chromoplot tool. These three linkage LGs are arranged according to their numbers in the Ensembl [103] and separated by vertical lines above profiles and by the alternation of gray and black colors (x-axis—genome position, y-axis—GC%); (B) Partial karyotype stained with 4',6-diamidino-2-phenylindole/ Chromomycin A3 (DAPI/CMA3) showing six pairs of larger chromosomes of the spotted gar with altering GC-rich regions in red and AT-rich regions in green. Reproduced with permission from [7].

