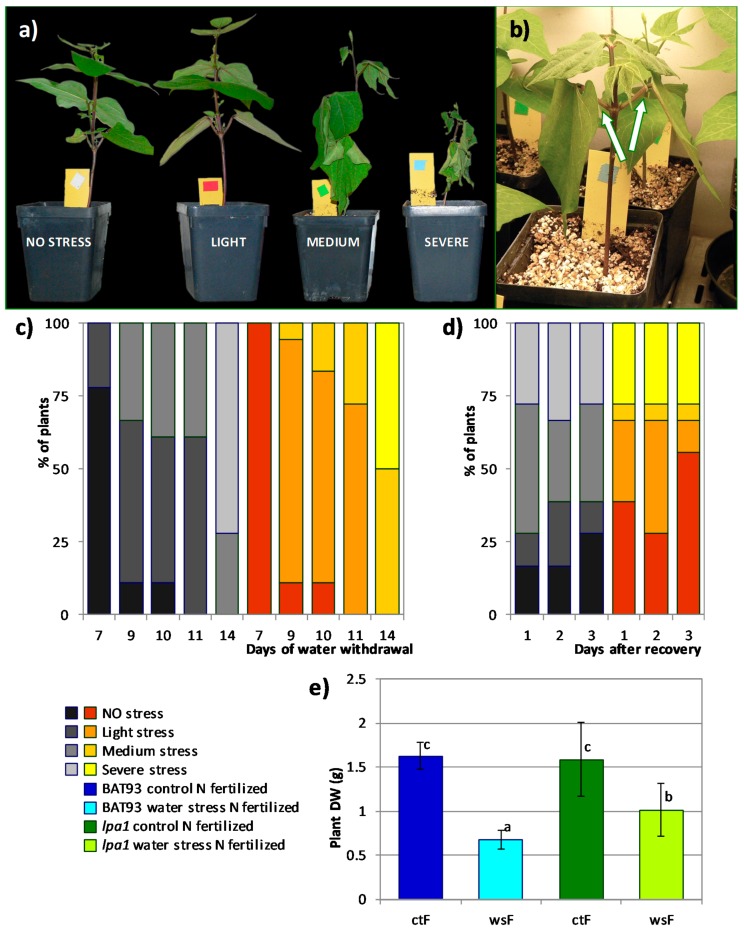
Figure 3.
Effect of water withdrawal on two weeks old fertilized wild type (wt) and lpa1 plants and response to one week of recovery. (a) Plants were classified, according to gradual level of water stress, into four phenotypical classes, showing no stress, light, medium or severe stress symptoms, as shown in the picture for wt plants as example. (b) Detail of a lightly stressed plant, showing epinastic cotyledonary leaves. (c) The percentage distribution of plants during the stress period, categorized in the four classes shown in (a) is indicated with darker to light colored bars, for wt (grey) and lpa1 (orange) plants. (d) Plant phenotype during the first three days of recovery period, recording similar stress symptoms as those described in (a) and (c). (e) Dry weight of control (ctF) and water stressed (wsF) plants at the end of one week of recovery, blue and green indicate wt and lpa1 plants, respectively. Equal lowercase letters correspond to equal mean for ANOVA with Tamhane T2 post hoc test. Bars represent ± SD.

