Figure 1.
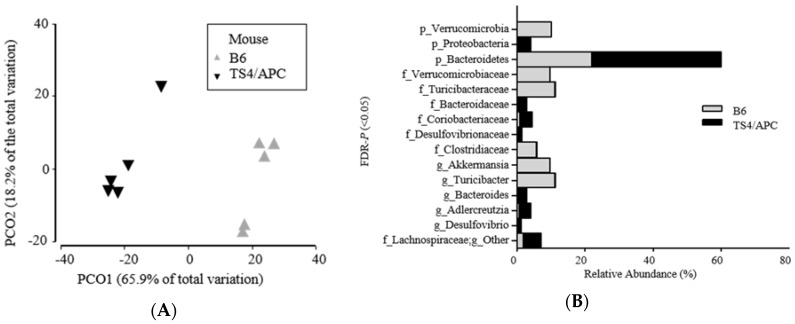
(A,B) Significantly different microbial profiles between TS4/APC (TS4Cre × cAPCl°×468 mice) chow-fed and B6 (C57BL/6J control mice) chow-fed mice feces: (A) Principal coordinate analysis (PCoA) profile of microbial diversity (genus) across all samples, with the percentage of variation explained by PC1 and PC2 indicated in the axis; (B) Stacked bars of significantly different (FDR-p ˂ 0.05) rarefied sequences of microbial taxa (relative abundance percentages of total bacteria at phylum, family, and genus) between mice groups.

