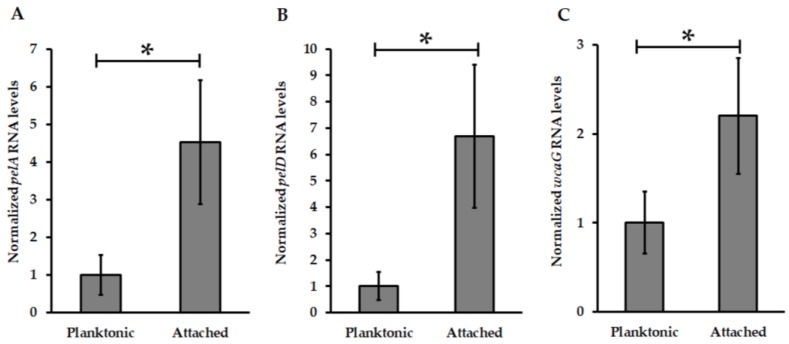
Figure 3.
Transcription levels analysis of Pel biosynthesis machinery encoding genes from At. thiooxidansT. Transcript levels of pelA (A), pelD (B) and wcaG (C) genes were measured by quantitative polymerase chain reaction (qPCR) and then normalized using DNA 16S and map genes. Values represent the average of four independent experiments ± standard deviation. Significant differences made by a one-way ANOVA test (p < 0.05) are noted (*).

