Figure 1.

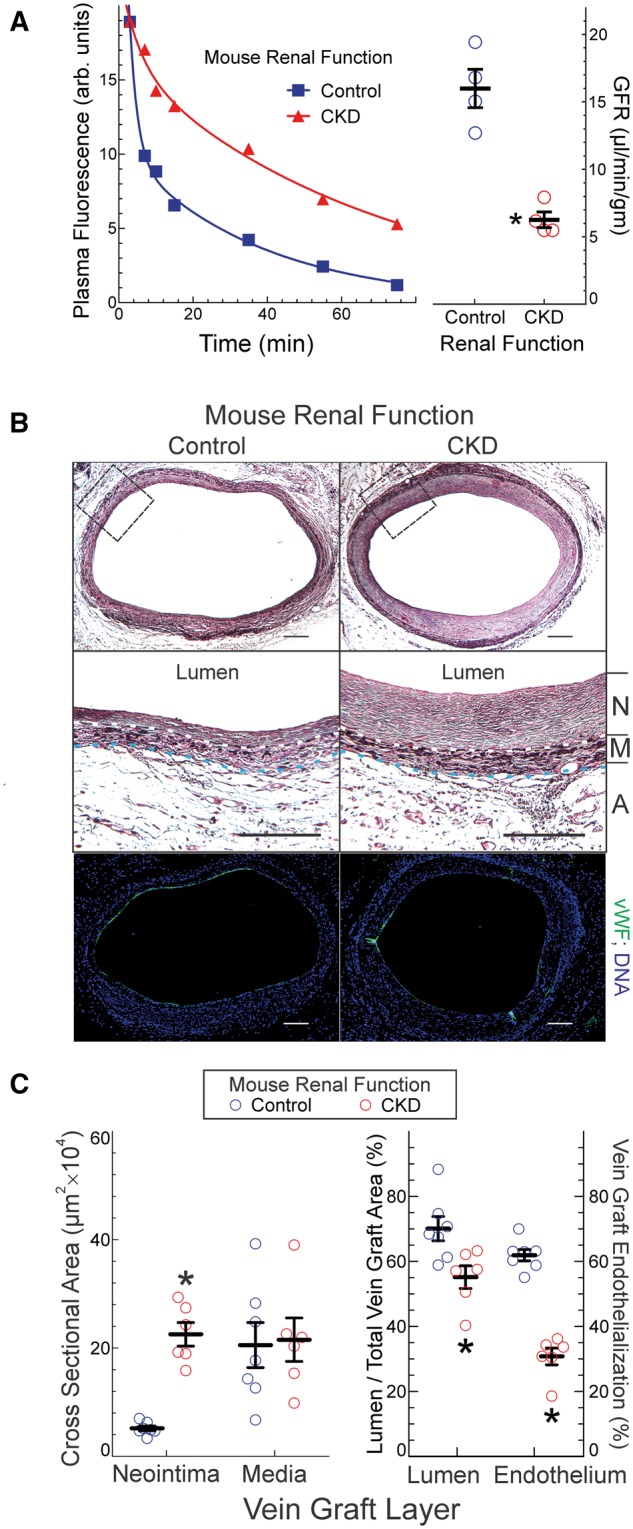
CKD exacerbates vein graft neointimal hyperplasia. (A), Mice were subjected to 5/6ths nephrectomy (CKD) or sham surgery (control); 2 week later, they were injected with FITC-inulin and subjected to sequential blood collections at the indicated times after injection; plasma fluorescence at each time point is plotted for individual CKD and control mice, at left. GFR was calculated from these decay curves and plotted (right panel) as means ±SE from 4 mice in each group. Compared with control: *P < 0.05 (t test). (B), CKD and 1/3rd-nephrectomized (control) mice were subjected to carotid interposition vein grafting, and vein grafts were harvested 4 week later after perfusion fixation. Serial cross sections were stained with a modified Masson trichrome (top) or with IgG targeting von Willebrand factor (vWF, green) and Hoechst 33 342 (DNA, blue). The area delineated by the dashed boxes (top) are enlarged and presented in the middle panels, in which dotted white and blue lines delineate the boundaries between neointima (‘N’) and media (‘M’), and between media and adventitia (‘A’), respectively. Scale bars = 50 μm. (C), Cross sectional areas for neointima, media, lumen and ‘total vein’ (excluding adventitia) were calculated by planimetry, and plotted as means ± SE from six mice in each group. ‘Vein graft endothelialization’ was calculated as the fraction of vein graft total luminal perimeter covered by vWF-positive (endothelial) cells, and plotted as the means ± SE from 6 mice in each group. Compared with control mice: *P < 0.05 (2-way ANOVA with post-hoc Sidak test).
