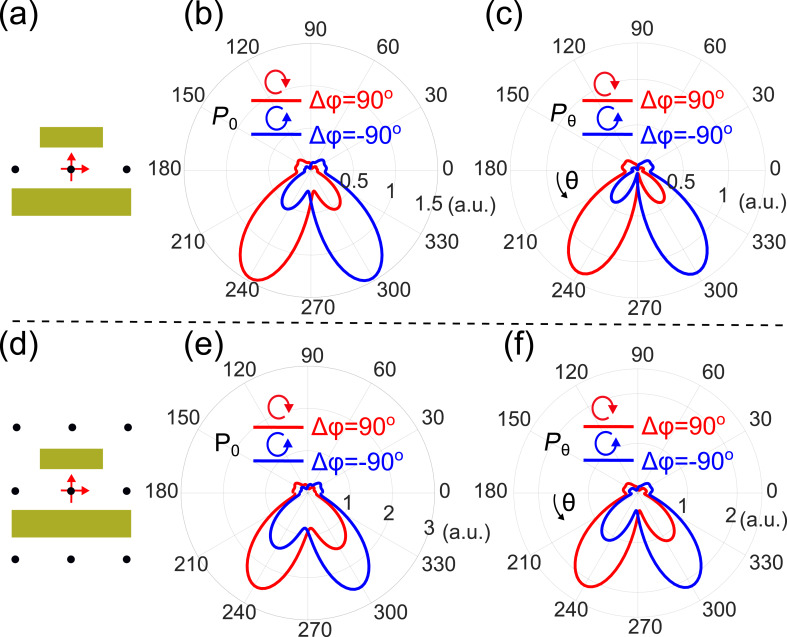
Figure 4.
Emission pattern averaged over multiple emitters. (a) Schematic of the three emitter positions inside the gap between the two bars, used to evaluate the average effects. (b, c) Polar plot of the total (P0) and azimuthal component (Pθ) of the far-field power distribution, after averaging over all three positions. (d) Schematic of the nine emitter positions used in simulations. (e, f) Polar plot of the total (P0) and the azimuthal (Pθ) components of the far-field power distribution, after averaging over all the nine positions.

