Figure 3.
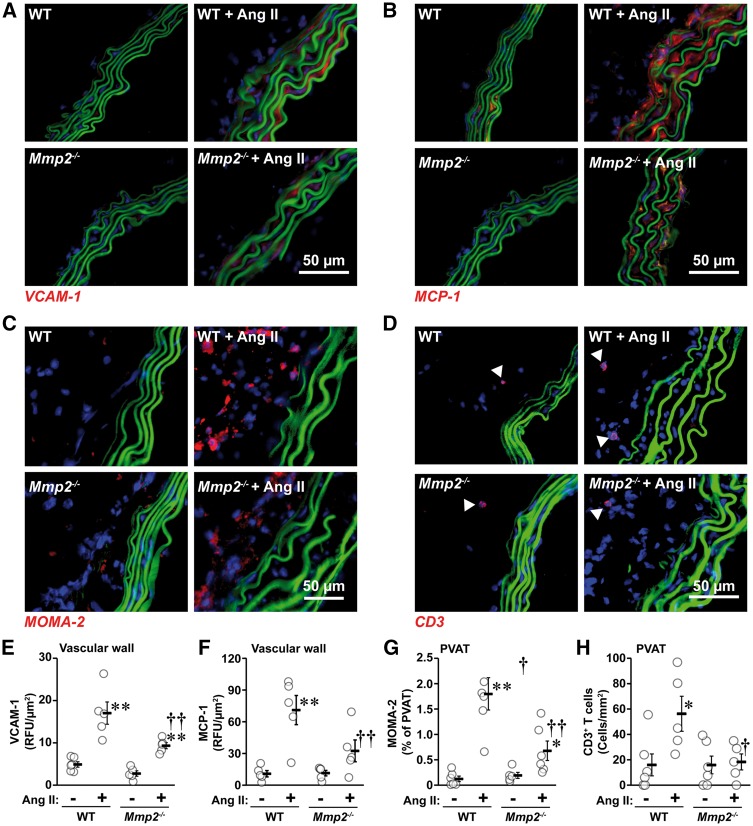
Mmp2 gene deletion reduced Ang II-induced inflammation. Aortic VCAM-1 (A and E) and MCP-1 (B and F) expression and MOMA-2+ monocyte/macrophage (C and G) and CD3+ T cell (D and H) infiltration were determined by immunofluorescence in the same groups as in Figure 1. Representative VCAM-1 (A, in red), MCP-1 (B, in red), MOMA-2+ monocyte/macrophages (C, in red), and CD3+ T cell (D, in red) immunofluorescence images of aortic sections are shown. Elastin autofluorescence and nuclear stain DAPI are shown in green and blue, respectively. Arrow heads indicate CD3+ T cells in D. Values are means ± SEM. Number of samples per group for E: WT = 6 and other groups = 5. For F: all groups = 5. For G: Mmp2-/- = 5 and other groups = 6. For H: WT and Mmp2-/- = 5 and Ang II-treated groups = 6. Data were analysed using two-way ANOVA followed by a Student–Newman–Keuls post hoc test. *P < 0.05 and **P < 0.001 vs. their respective untreated controls and †P < 0.05 and vs. ††P < 0.01 WT + Ang II.

