Figure 3.

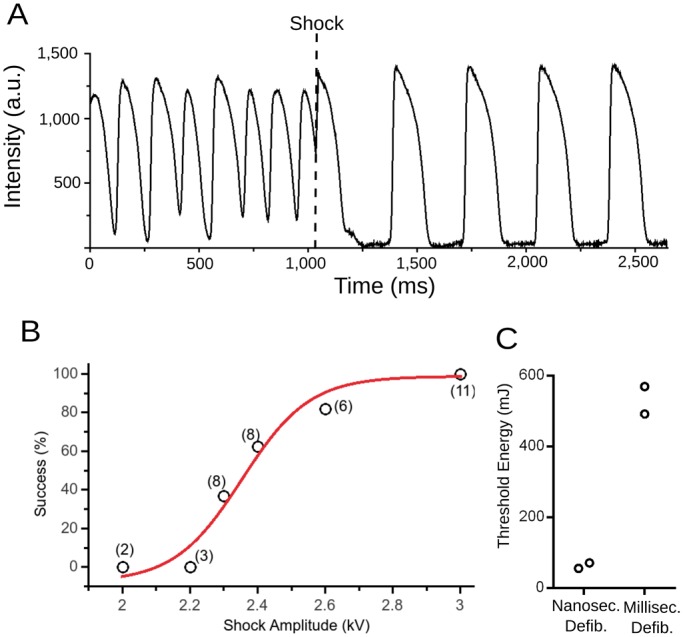
Defibrillation with nanosecond shock (12 hearts). (A) Optical recording from a representative surface location on the cardiac surface. The heart is initially fibrillating, before a single shock is applied at the time marked with a dashed line. After the shock, sinus rhythm is restored. (B) Defibrillation success rate as a function of stimulus amplitude. Numbers in parentheses indicate how many observations contributed to each of the data points. Red line shows a sigmoidal function fitted to the data. (C) Comparison of defibrillation for millisecond defibrillation (monophasic) and nanosecond defibrillation (2 hearts, see text for comparison with previous data regarding the energy threshold of millisecond defibrillation). Black empty circles indicate the threshold energies that we determined in individual hearts. Grey horizontal lines mark averages and standard error of the mean.
