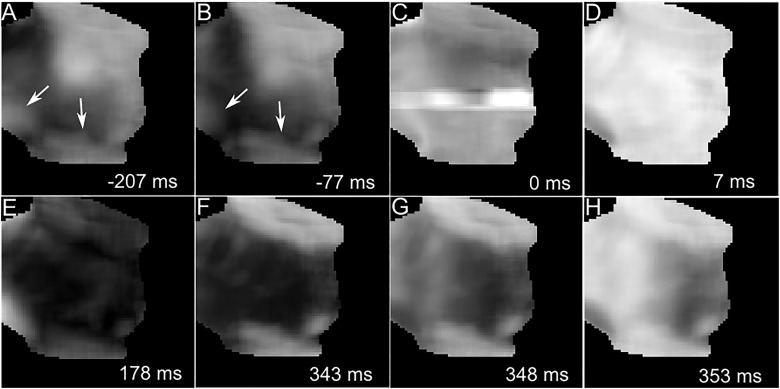
Figure 4.
Mechanism of nanosecond defibrillation. Panels A–H show a series of snapshots of transmembrane voltage distribution, before (A, B), at (C), and after (D–H) the application of a nanosecond shock to a heart that exhibits re-entry. Dark areas are at resting transmembrane potential, bright areas are depolarized. White numbers in the lower right corner state the time the snapshot was taken, relative to the shock application (negative numbers mean that the snapshot was taken before the shock). White arrows indicate the direction of wave propagation.

