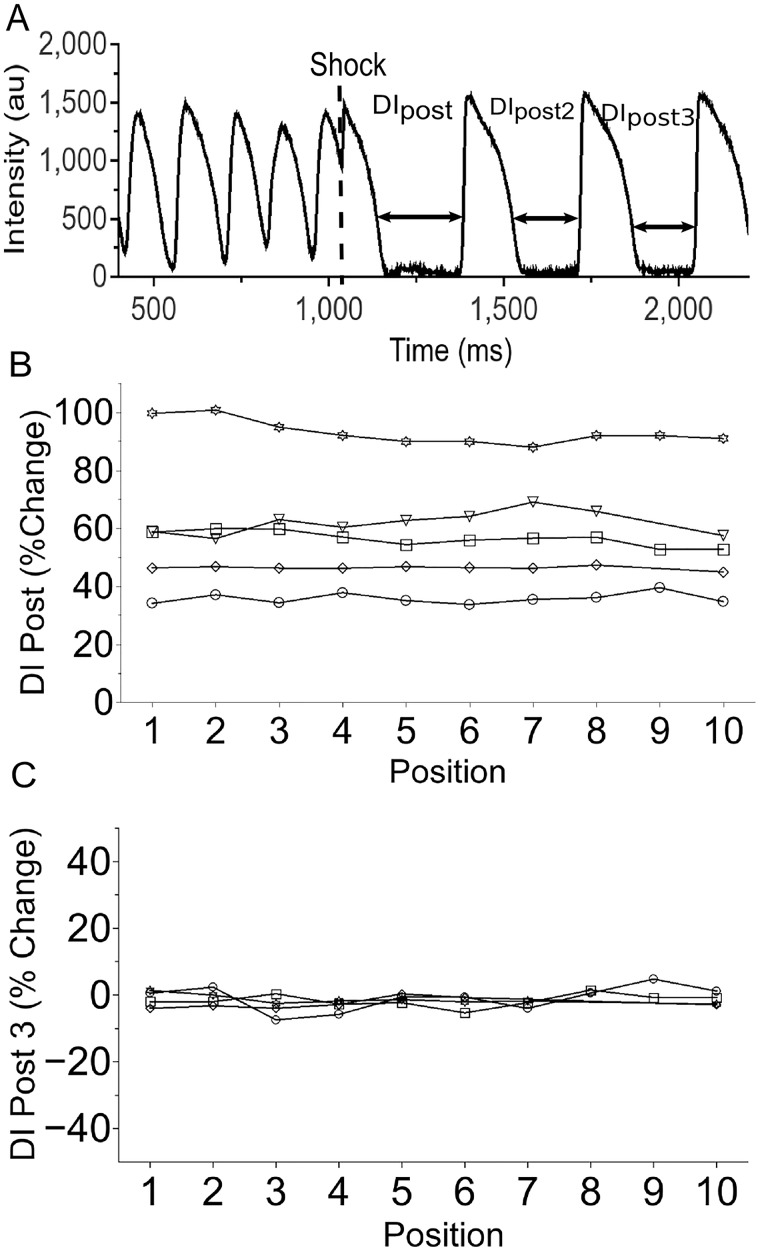
Figure 7.
Effect of nanosecond defibrillation on diastolic interval (5 hearts). (A) Sample optical recording from cardiac surface to introduce our notation (DI_post, DI_post, 2, and DI_post, 3). (B) Change of DI_post (relative to DI_post, 2) as a function of electrode position for 5 hearts (same electrode positions as in Figure 6). Different symbols (‘inverted triangle’, ‘diam’, ‘open circle’, ‘open star’, and ‘open square’) represent different hearts. (C) Change of DI_post, 3 (relative to DI_post, 2) as a function of electrode position for 4 hearts.

