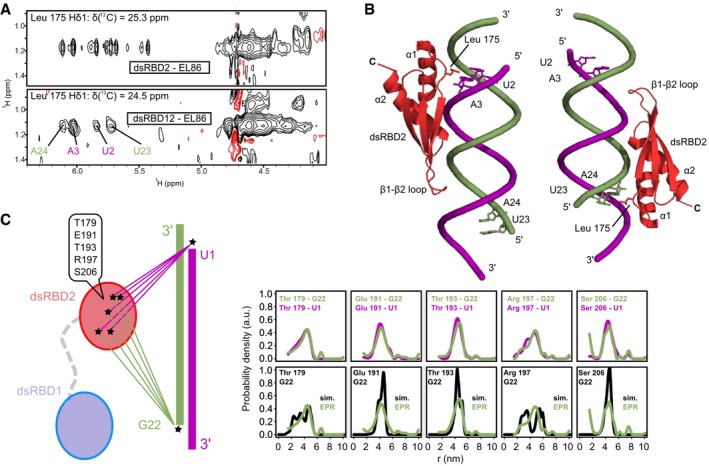
Figure 2. DsRBD2 positioning on EL86 in RNA‐bound dsRBD12.

- Selected regions of 3D 13C‐edited filtered NOESY spectra collected on the dsRBD2‐EL86 (top) and dsRBD12‐EL86 (bottom) complexes, showing intermolecular NOE cross‐peaks between dsRBD2 Leu175 Hδ1s and EL86 ribose protons. Unambiguous assignments of EL86 H1′ are colored in blue (upper strand) and green (lower strand).
- Structural models of the dsRBD2‐EL86 complex showing the two orientations compatible with the intermolecular NOEs observed in the dsRBD12‐EL86 complex.
- dsRBD2‐EL86 distances measured by EPR in the dsRBD12‐EL86 complex. (Left, scheme) Five pairwise distance distributions were measured between the dsRBD2 β‐sheet surface (Cys179, Cys191, Cys193, Cys197, or Cys206) and the 5′ termini (Ura1 or Gua22) of EL86. DsRBD1 (light blue) and dsRBD2 (red) are connected by the native flexible linker (gray dashes). Nitroxide spin labels are represented by asterisks. (Right, upper row) Superposition of experimental distance distributions between dsRBD2 and either EL86 Ura1 (magenta) or Gua22 (green) strands. (Right lower row) Superposition of back‐calculated (black) and experimental (green) distance distributions between EL86 Gua22 and each of the five spin labels attachment sites on dsRBD2. Simulated distance distributions were calculated from the two models of dsRBD2‐EL86 shown in (B).
