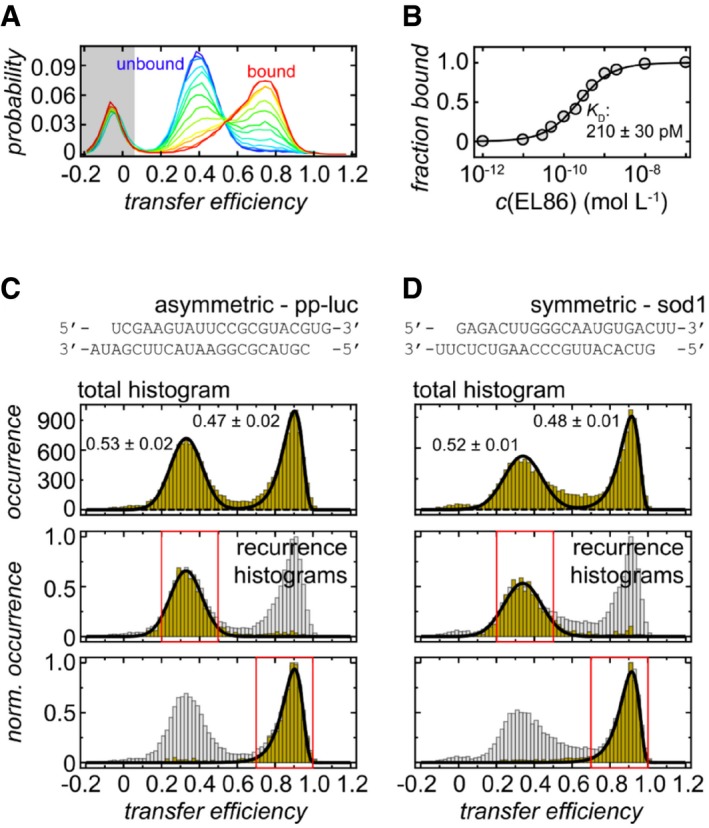
Figure EV3. TRBP‐RNA binding isotherm and sequence dependence of RNA binding as characterized by single‐molecule FRET .

-
ANormalized transfer efficiency histograms of Cy3B‐CF660R‐labeled dsRBD12 in the presence of different EL86 RNA concentrations. Free dsRBD12 (blue) can be distinguished from RNA‐bound dsRBD12 (red) via its transfer efficiency. The peak in the gray‐shaded area originates from molecules without an active acceptor fluorophore and is not included in the analysis.
-
BRNA binding curve generated from the plots shown in panel (A). The experimental data were fitted to a binding isotherm (solid line).
-
C, DTransfer efficiency histograms of CF660R‐labeled dsRBD12_22‐235 C158S in complex with Cy3B‐labeled pp‐luc and sod1. Top: Transfer efficiency histograms reveal two subpopulations that are equally populated. Errors associated with their estimates from multiple measurements. Bottom: Recurrence transfer efficiency histograms (Hoffmann et al, 2011) were used to extract subpopulation‐specific fit parameters for the peak shapes. Red boxes highlight the initial transfer efficiency range used for the analysis. The recurrence interval T was set to (0, 10 ms). See Materials and Methods section for details.
