. 2018 Feb 15;37(6):e97089. doi: 10.15252/embj.201797089

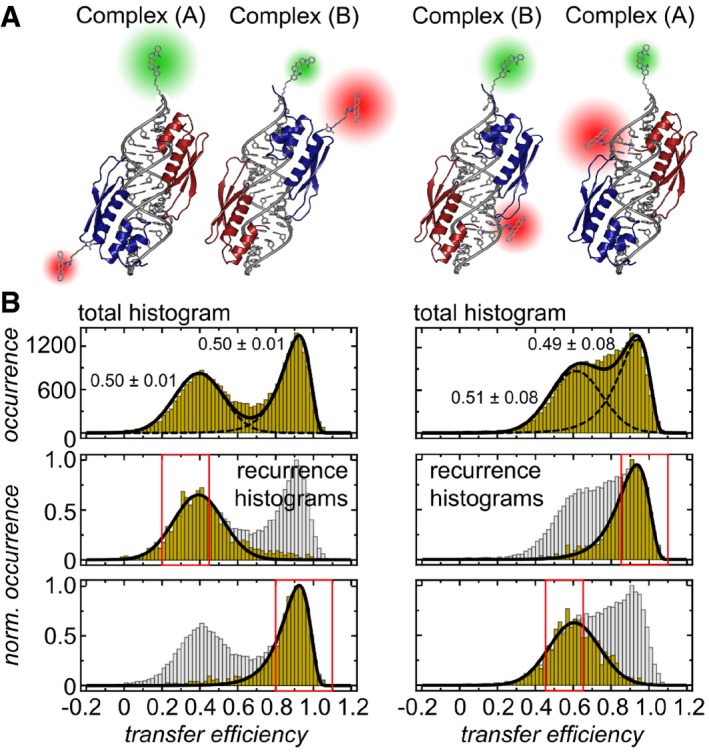
Figure 4. Quantifying the relative occurrence of the two possible configurations of dsRBD12 on EL86 by single‐molecule FRET .

Figure 4

  1. Cartoons of CF660R‐labeled dsRBD12 C158S (left) and dsRBD12 M100S (right) bound to Cy3B‐labeled EL86. The different domain arrangements of dsRBD12 on EL86 are characterized by different inter‐dye distances, which were approximated as distances between their attachment points (as M100 is not resolved in the solution structure, the nearest resolved neighbor G98 was used, resulting in an uncertainty of 7 Å, i.e., the contour length of two residues).
  2. Transfer efficiency histograms of CF660R‐labeled dsRBD12_22‐235 C158S (left) and dsRBD12_22‐235 M100S (right) in complex with Cy3B‐labeled EL86. Top: Transfer efficiency histograms exhibit two subpopulations that are equally likely to occur. Errors associated with relative occurrences correspond to the standard deviation. Bottom: Recurrence transfer efficiency histograms were used to extract subpopulation‐specific fit parameters. Red boxes highlight the initial transfer efficiency range ΔE. The recurrence interval T was set to (0, 10 ms). See Materials and Methods for details.