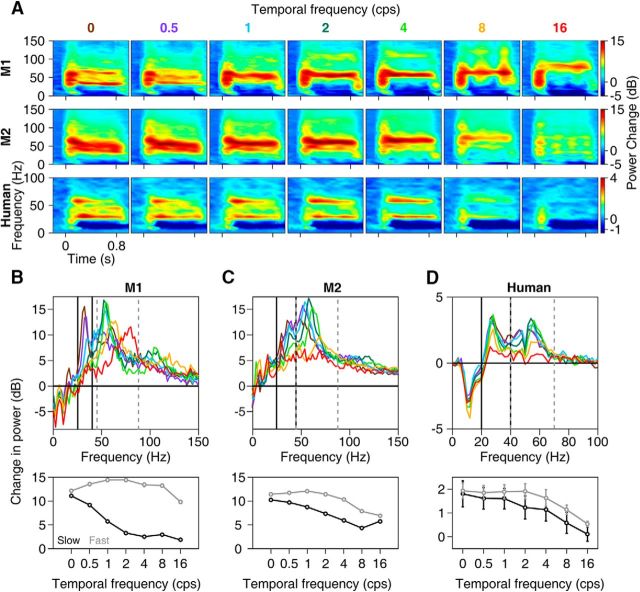
Figure 4.
Tuning for temporal frequency. A, Change in time–frequency power spectra across seven drift speeds averaged across 65 sites in Monkey 1 (top row), 36 sites in Monkey 2 (middle row), and 12 human subjects (bottom row). For monkeys, the orientation that induced the largest slow gamma (0° and 45° for the two monkeys; Figure 4-1 shows results from orientations that induced largest fast gamma) was used. B–D, Corresponding change in power across frequency (top) and total power in slow and fast gamma bands (bottom) for Monkey 1 (B), Monkey 2 (C), and humans (D).

