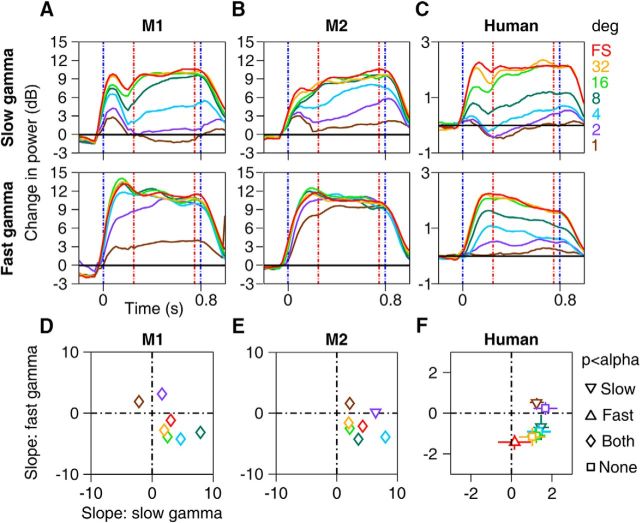
Figure 6.
Evolution of gamma power in time. A–C, Change in power spectra across time for slow (top row) and fast gamma (bottom row) averaged across 65 electrodes for Monkey 1 (A), 34 electrodes in Monkey 2 (B), and across 12 human subjects (C) computed at the preferred orientation for each gamma band. D–F, Scatter plots showing regression slopes for slow versus fast gamma in the stimulus period (0.25–0.75 s, as indicated by red dashed lines in A–C) for seven stimulus diameters. Error bars indicate SEM and are smaller than the size of the symbols when not visible. Different symbols indicate whether the mean slopes were significantly different from zero (p < 0.05, t test, Bonferroni corrected for the number of sizes) for slow and fast gamma (as indicated in the extreme right).

