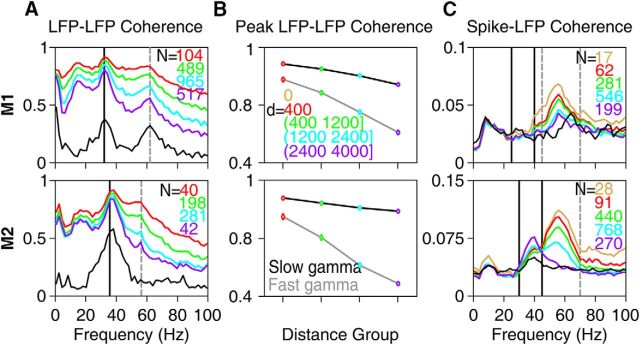
Figure 7.
Field–field and spike–field coherence. A, LFP–LFP phase coherence spectra for different interelectrode distances for Monkeys 1 (top row) and 2 (bottom row). Interelectrode distance ranges (d, in μm) are shown in B. The number of pairs (N) for each group is indicated on the top right corner. LFP–LFP phase coherence when both are taken from the same electrode (i.e., interelectrode distance of zero) is trivially 1 at all frequencies and is therefore omitted. Mean LFP–EEG phase coherence is shown in black. B, Average LFP–LFP phase coherence at the peak slow (32 and 36 Hz for the two monkeys) and fast gamma bands (62 and 56 Hz) as a function of interelectrode distance. C, Mean spike–LFP coherence for spike–LFP pairs separated by different interelectrode distances. Mean spike-EEG coherence is shown in black.

