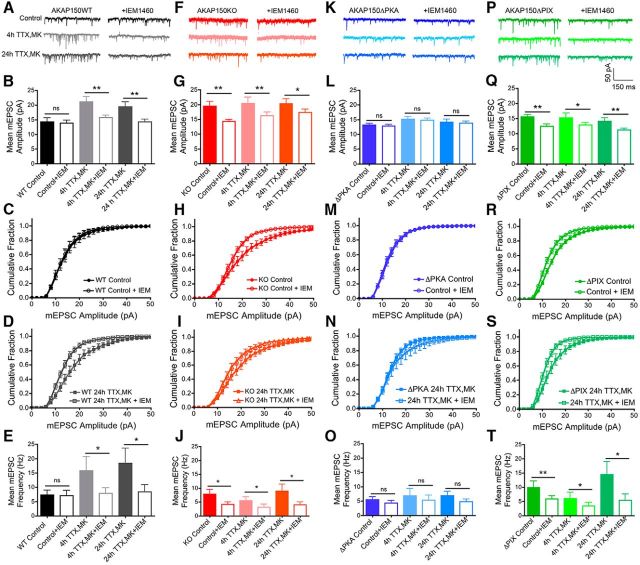
Figure 3.
Rapid homeostatic synaptic potentiation in hippocampal neurons requires CP-AMPAR synaptic recruitment that is mediated by AKAP150-anchored PKA and opposed by AKAP150-anchored CaN. A, Representative mEPSC recordings, (B) bar graph of mean mEPSC amplitude, (C, D) cumulative plots of mEPSC amplitudes, and (E) bar graph of mean mEPSC frequency showing that the CP-AMPAR antagonist IEM1460 (70 μm) acutely inhibits expression of rapid homeostatic scaling-up in WT mouse neurons. The same neurons were recorded for a 4–5 min baseline period followed by 5–10 min of additional recording in IEM1460. IEM significantly depresses mEPSC amplitude and frequency after induction of homeostatic scaling up with 4 h TTX/MK (*p < 0.05, **p < 0.01 to +IEM by unpaired t test) but not under Control conditions. F, Representative mEPSC recordings, (G) bar graph of mean mEPSC amplitude,(H, I) cumulative plots of mEPSC amplitudes, and (J) bar graph of mean mEPSC frequency showing that neurons from AKAP150KO mice express IEM1460-sensitive synaptic CP-AMPARs that are responsible for basally increased mEPSC activity (*p < 0.05, **p < 0.01 to +IEM by paired t test) and occlude homeostatic scaling-up in response to 4 h TTX/MK (*p < 0.05, **p < 0.01 to +IEM by paired t test) and 24 h TTX/MK treatments (*p < 0.05, **p < 0.01 to +IEM by paired t test). K, Representative mEPSC recordings, (L) bar graph of mean mEPSC amplitude, (M, N) cumulative plots of mEPSC amplitudes, and (O) bar graph of mean mEPSC frequency showing that impaired homeostatic scaling-up in neurons from AKAP150ΔPKA mice is associated with a failure to recruit CP-AMPARs to synapses following TTX/MK treatments. P, Representative mEPSC recordings, (Q) bar graph of mean mEPSC amplitude, (R, S) cumulative plots of mEPSC amplitudes, and (T) bar graph of mean mEPSC frequency showing that neurons from AKAP150ΔPIX mice express IEM1460-sensitive synaptic CP-AMPARs under control conditions (**p < 0.01 to +IEM by paired t test) that prevent homeostatic scaling-up in response to subsequent TTX/MK treatments, despite not exhibiting any basal increases in mEPSC amplitude (*p < 0.05, **p < 0.01 to +IEM by paired t test). Error bars indicate SEM.

