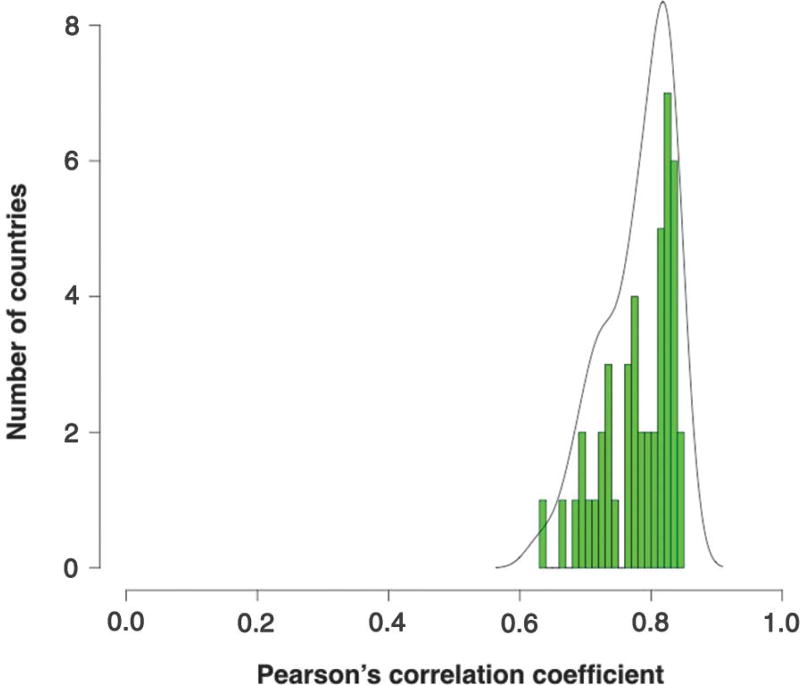
Fig. 1. Correlations between stem cell divisions and cancer incidence in different countries.
For each country, the correlation between the number of stem cell divisions in 17 different tissues and the lifetime incidence of cancer in those tissues was calculated. This resulted in correlation coefficients, which were grouped and plotted into a histogram. In this histogram, the x axis represents the correlation coefficients and the y axis represents the number of countries with the corresponding correlation coefficient. For example, there were seven countries in which the correlation between the number of stem cell divisions and cancer incidence was between 0.82 and 0.83; these seven countries are represented by the tallest green bar in the histogram. The median correlation coefficient over all countries was 0.8. The black line represents the density for the observed distribution of the correlation coefficient among different countries.

