
Figure 1. Absolute and Proportional Cardiometabolic Disease Mortality Associated With Suboptimal Dietary Habits Among US Men and Women in 2012.
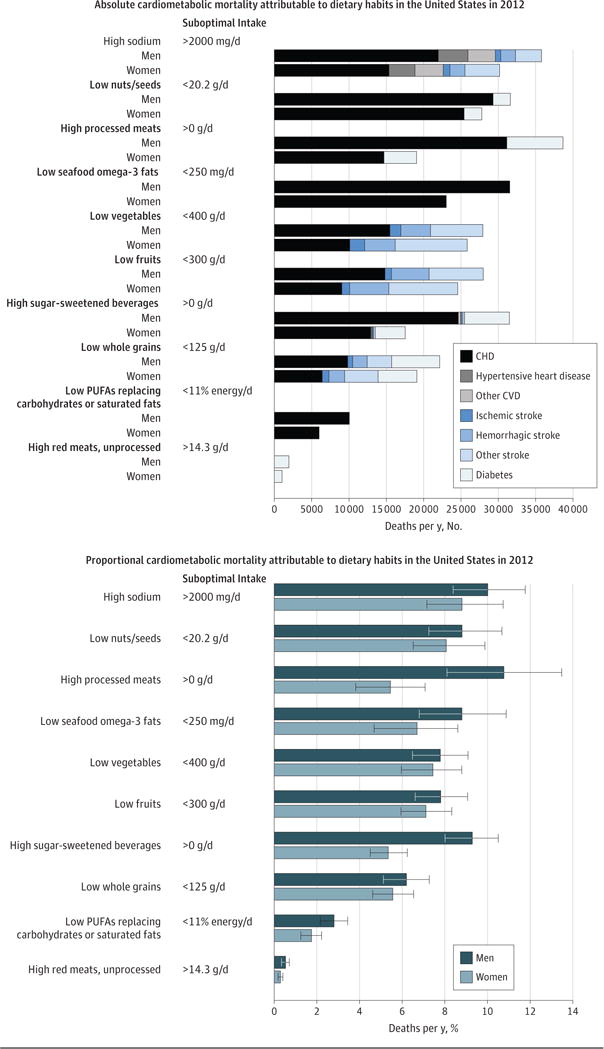
The bars represent the estimated absolute number (top panel) and percentage (bottom panel) of cardiometabolic deaths related to 10 dietary factors compared with optimal intakes. The dietary factors are listed in rank order of total mortality in men and women combined. Error bars indicate 95% uncertainty intervals. CHD indicates coronary heart disease; CVD, cardiovascular disease; PUFA, polyunsaturated fat.