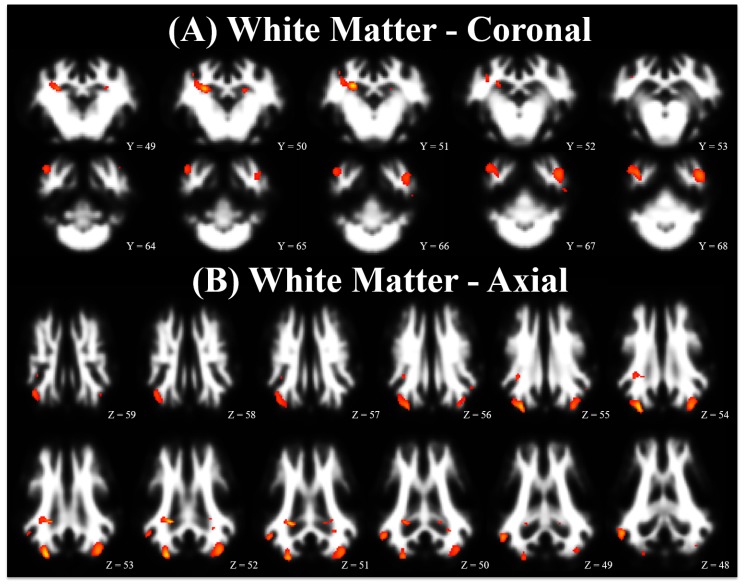
Figure 3.
Pictured here is a population-averaged pig brain, with a statistical heat map indicating differences in white matter between dietary treatment groups. The range of red-to-yellow indicates the degree of statistical difference from significant pseudo-t values of 4.00 to 6.40, respectively, in voxels where CONT pigs exhibited increased white matter concentrations compared with ID pigs (i.e., CONT white matter > ID white matter). Notably, no differences were observed where ID pigs exhibited increased white matter concentrations compared with CONT pigs. (A) Brain images in coronal orientation and (B) Brain images in axial orientation. Abbreviations: control (CONT); iron deficient (ID).

