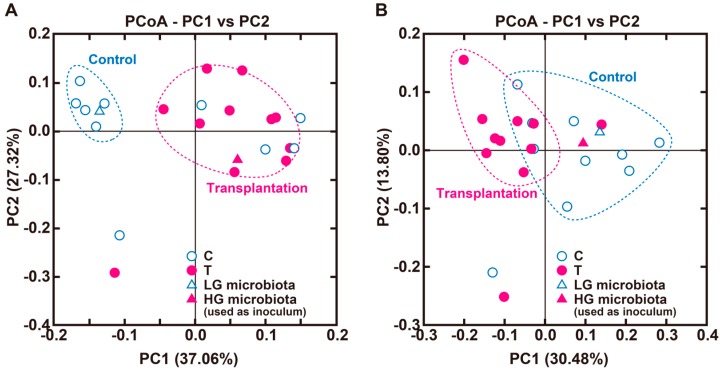
Figure 1.
Principle coordinate analysis plot based on weighted (A) and unweighted (B) UniFrac distances of microbial communities in the cecum of control and transplantation rats. Sample clustering was significant between both groups (p = 0.086 and p = 0.006, respectively, PERMANOVA). control group, n = 10; transplantation group, n = 11. C, control group; HG, high H2 generators; LG, low H2 generators; PCoA, principal coordinate analysis; PERMANOVA, permutational multivariate analysis of variation; T, transplantation group.

