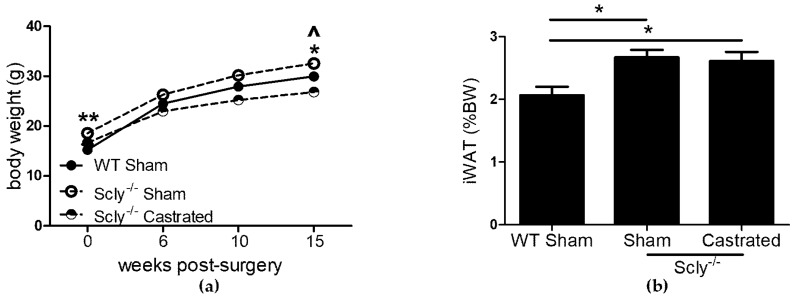
Figure 2.
The effects of castration on body and fat weight. Unless indicated, metabolic parameters were measured in mice that were 20–22 weeks of age. For WT sham-operated mice: n = 6, Scly−/− sham-operated mice: n = 8, Scly−/− castrated mice: n = 6. (a) Body weight at the indicated time points after surgery. One-way ANOVA was used to test each time point (6 weeks: F2,17 = 5.88, p = 0.01; 10 weeks: F2,17 = 14.0, p = 0.0003; 15 weeks: F2,17 = 18.66, p < 0.0001) and Dunnett’s post-test was used to compare all groups to WT (WT vs. sham: ^ p < 0.05, WT vs. castrated: * p < 0.05, ** p < 0.01); (b) inguinal WAT (iWAT) depots displayed as % of bodyweight (one-way ANOVA: F2,17 = 5.94, p = 0.01). All data are represented as means ± S.E.M.

