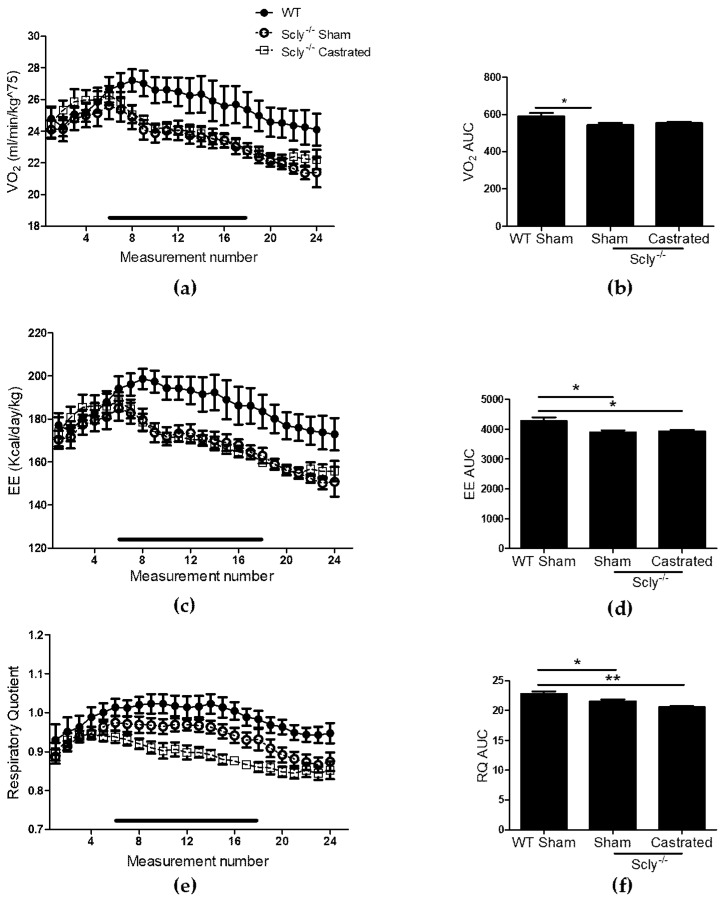
Figure 3.
The effects of castration on energy expenditure in 22-week-old mice. Measurements were taken over 24 h, once every hour. Each point represents an average of n = 6 for WT and castrated mice, and n = 8 for sham-operated mice. The black bar corresponds to measurements taken during the dark cycle. (a) VO2 profile over 24 h; (b) Area under the curve (one-way ANOVA: F2,14 = 3.48, p = 0.06); (c) energy expenditure (EE); (d) area under the curve for energy expenditure (one-way ANOVA: F2,14 = 5.76, p = 0.01); (e) respiratory quotient (RQ) over 24 h; (f) area under the curve (one-way ANOVA: F2,14 = 8.81, p = 0.003). Dunnett’s post-test was used to compare all columns to WT (* p < 0.05, ** p < 0.01). All data are represented as means ± S.E.M.

