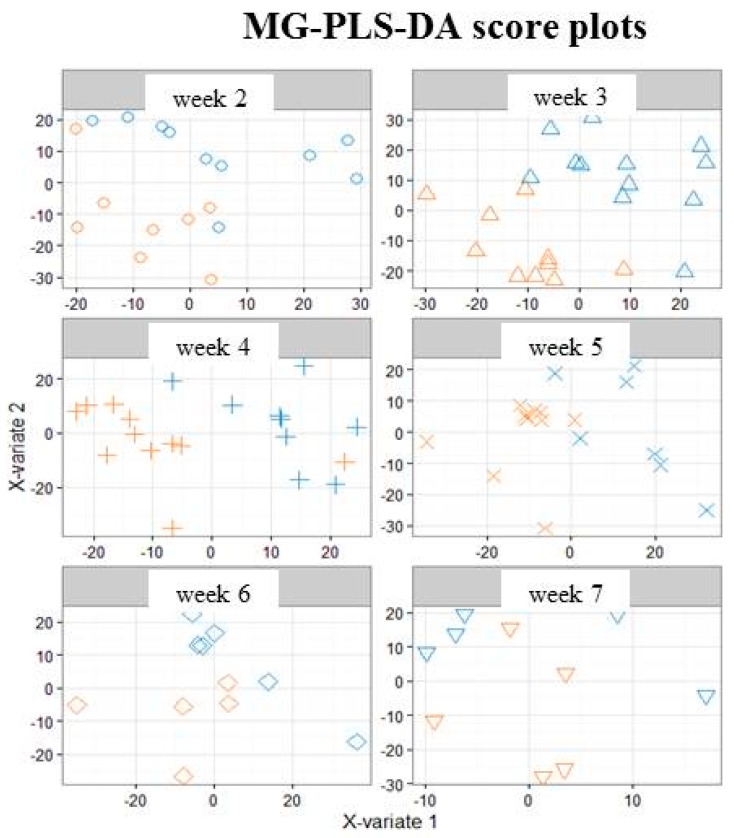
Figure 3.
Multi-group PLS-DA score plots based on the LC-ESI+-HRMS profiles (3451 features, 118 milks) obtained on human preterm milk. Representation of the individuals: milk provided to preterm infants who experienced “faster” (orange) or “slower” (blue) growth from Week 2 to Week 7 of lactation. MB-PLS-DA score plots: ○ Week 2; ∆ Week 3; + Week 4; × Week 5; ◊ Week 6; ∇ Week 7.

