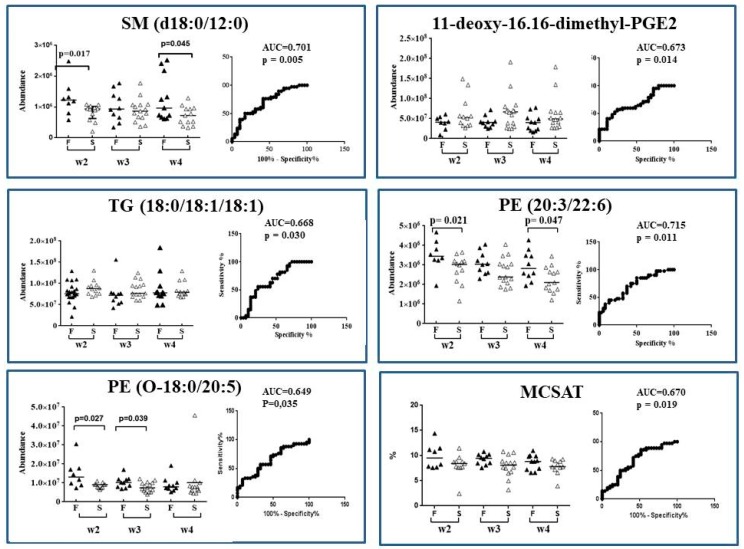
Figure 5.
Scatter plot and ROC plot analysis using lipids biomarkers abundance (SM (d18:0/12:0), TG (18:0/18:1/18:1), PE (O-18:0/20:5), PE (20:3/22:6), MCSAT and one deoxy-dimethyl-PGE2) in breast milk provided to preterm infants who experienced “faster” (black triangle, F group) versus “slower” (white triangle, S group) growth during hospital stay. Scatter plot (median): from w2 to w4 of lactation period; ROC plot: over the entire W2–W4 lactation period. ▲ Faster growth group (F); Δ slower growth group (S).

