Figure 2.
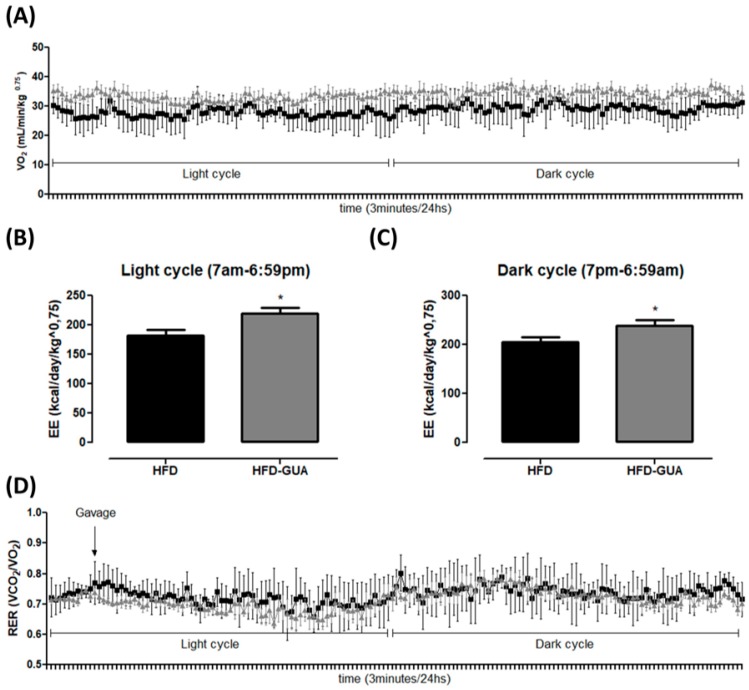
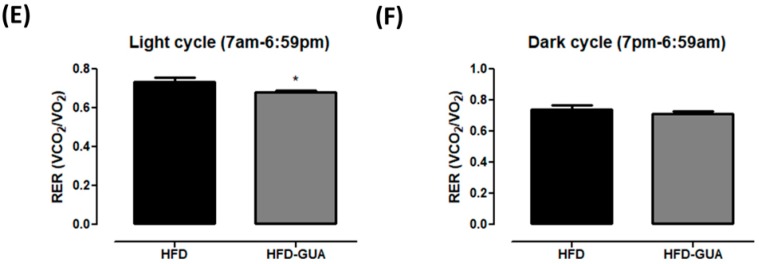
(A) Illustrative evolution of VO2 (mL/min/kg0.75) during 24 h after eight weeks of treatment. Light cycle (7 a.m. to 6:59 p.m.) and dark cycle (7 p.m. to 6:59 a.m.); (B) Energy expenditure (EE) (kcal/day/kg0.75) in the light cycle after weigh weeks of treatment; (C) EE (kcal/day/kg0.75) in the dark cycle after weigh weeks of treatment; (D) Illustrative evolution of Respiratory exchange ratio (RER) during 24 h after eight weeks of treatment; (E) Respiratory exchange ratio (RER) in the light cycle; (F) Respiratory exchange ratio (RER) in the dark cycle. Black line/bars correspond to HFD-group (n = 6) and grey line/bars correspond to HFD-GUA group (n = 6). * p < 0.05.


