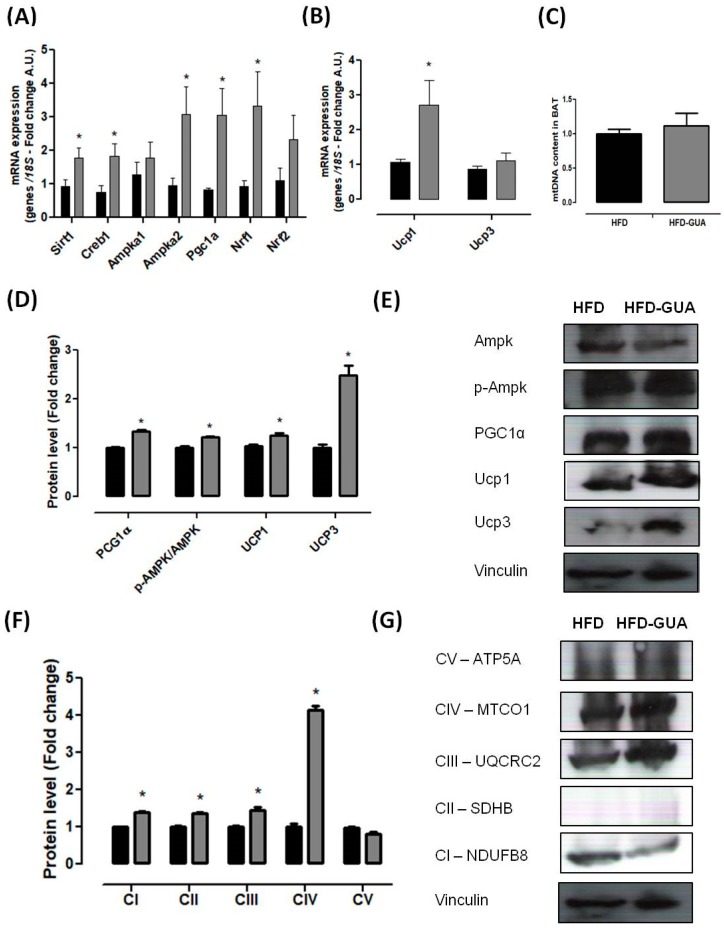
Figure 4.
(A) Brown adipose tissue mRNA expression of Pgc1α, Creb1, Ampka1, Ampka2, Nrf1, Nrf2 and Sirt1 after eight weeks of treatment; (B) Brown adipose tissue mRNA expression of Ucp1 and Ucp3 after eight weeks of treatment; (C) mtDNA quantification after eight weeks of treatment; (D,E) Brown adipose tissue protein level of Pgc1α, p-Ampk/Ampk, Ucp1 and Ucp3; and illustrative images of protein content by western blotting; (F,G) Brown adipose tissue protein level of subunits of the five OXPHOS complexes and illustrative images of protein content by western blotting. All samples were normalized using housekeeping 18S gene and, afterwards, the HFD-GUA group was normalized by the HFD group. The equation 2−ΔΔCt was used to calculate the fold change. * p < 0.05 using Student’s t-test. Black bars correspond to the HFD-group (n = 6) and grey bars correspond to the HFD-GUA group (n = 6). Error bars reflect SEM.

