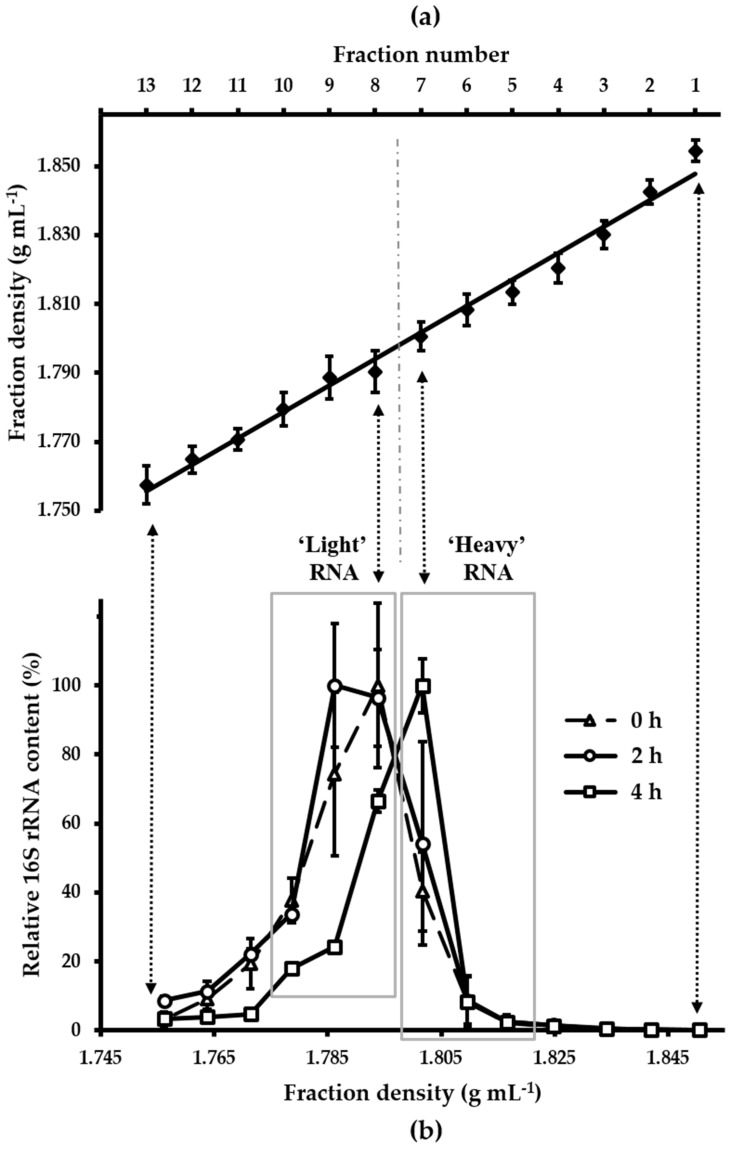
Figure 1.
(a) Density of isopycnic density gradient fractions. Means and standard errors (SEM) of nine gradients are shown. For each fraction, the SEM was ≤0.006 g mL−1. The vertical dash dot line divides the density gradient into ‘heavy’ (≤fraction 7) and ‘light’ (≥fraction 8) fractions; (b) Distribution of relative amounts of 16S rRNA. RNA from the isopycnic density gradients was collected before (0 h) or after administration of [U13C] starch (2 h and 4 h). Means and SEMs of three technical replicates for each gradient fraction per sampling time are shown. To facilitate comparison between the different gradients, RNA content is calculated as a proportion (%) of the fraction containing the highest RNA concentration (100%) per gradient [32]. Boxes indicate ‘heavy’ and ‘light’ density fractions analyzed for microbiota composition. Vertical arrows indicate corresponding fraction numbers in (a,b).

