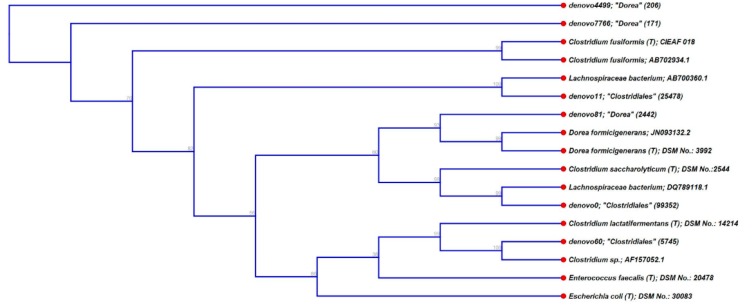
Figure 4.
Dendrogram showing the relatedness of the three most abundant OTUs of the bacterial taxa that differed significantly (p ≤ 0.05) between ‘light’ and ‘heavy’ RNA fractions (i.e., unclassified Clostridiales and Dorea spp.) to their next cultured relatives according to a BLAST search. Escherichia coli and Enterococcus faecalis were used as outgroups.

