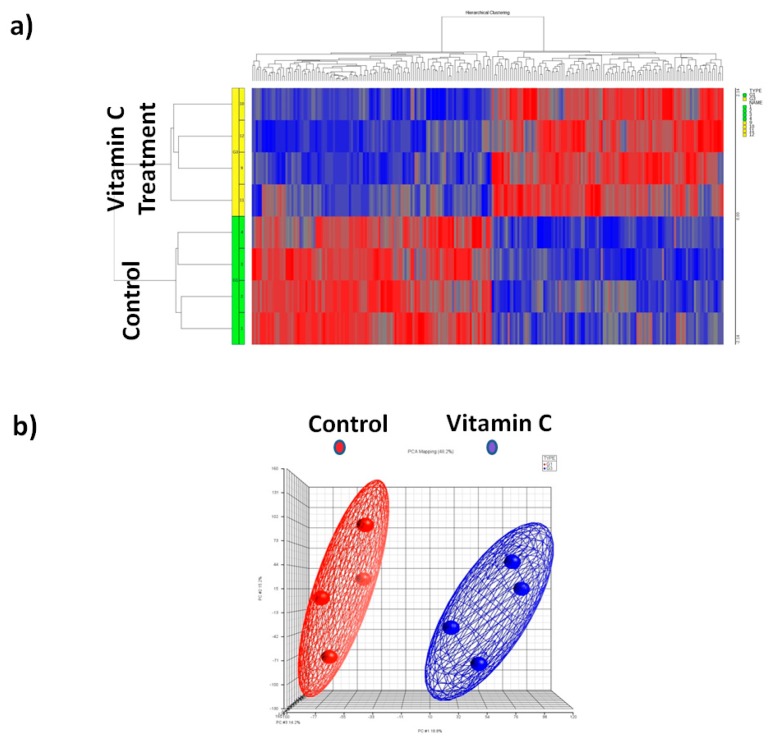
Figure 3.
Differential miRNA expression in human bone marrow stromal cells after vitamin C treatment (n = 4 each group). (a) The heat-map showing the differential expression pattern of miRNAs compared to control group; (b) Principle component analysis (PCA) mapping of vitamin C treatment and control samples. Control group (indicated by red color) was clustered distinctly from vitamin C treated group (indicated by blue color).

