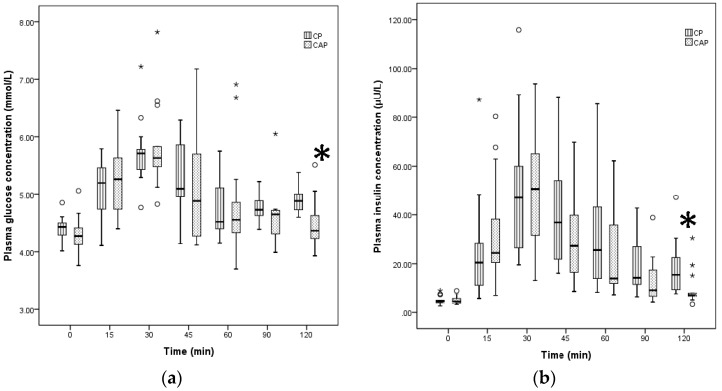
Figure 1.
Plasma glucose (a) and insulin (b) after ingestion of two liquid test foods. CP = concept product; CAP = commercially available product; Benjamini Hochberg with corrected levels of significance p = 0.0228; * extreme outliers (median ± 3.0 interquartile range (IQR)); ° inner-fence or minor outliers (median ± 1.5 IQR). Differences in the median of glucose and insulin responses between CAP and CP at 120 min * p < 0.02, based on non-parametric Wilcoxon signed rank test.

