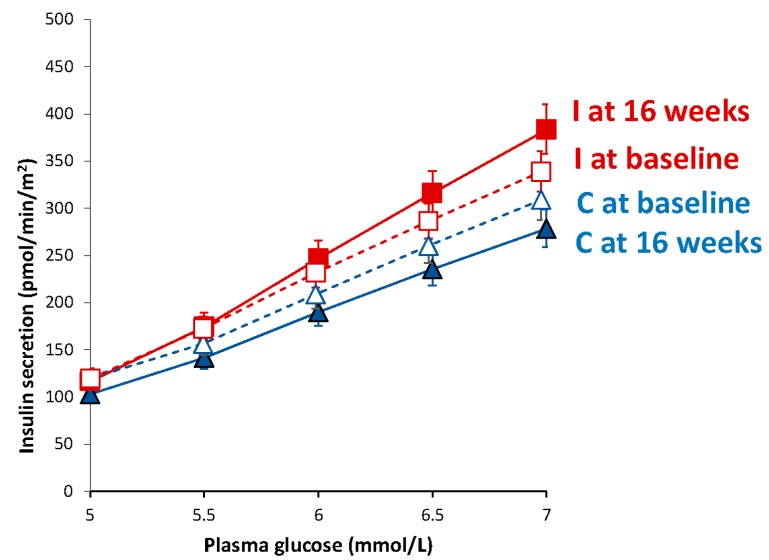
Figure 2.
Dose-response insulin secretion in response to different plasma glucose levels. Triangles with the blue line represent the control group (empty triangles and a dashed line at baseline, and full triangles with a full line at 16 weeks), while squares with the red line show data from the intervention group (empty squares with a dashed line at baseline, and full squares with a full line at 16 weeks). Data are given as means with 95% CIs.

