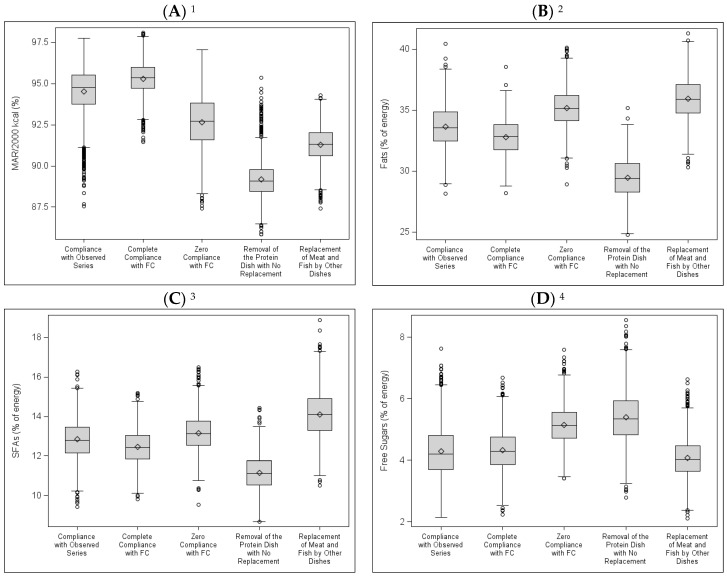
Figure 4.
Nutritional quality of simulated series according to five scenarios: Box Plots (A) Mean Adequacy Ratio (MAR, % of adequacy for 2000 kcal); (B) Fats (% of energy); (C) Saturated Fatty Acids (SFAs, in % of energy); (D) Free Sugars (% of energy). 1 For MAR/2000 kcal, the averages are statistically different (p < 0.05) from one series to another. 2 For fats (% of energy), the averages are statistically different (p < 0.05) from one series to another, except between “Zero Compliance with FC” and “Replacement of Meat and Fish with Other Dishes”. 3 For SFAs (% of energy), the averages are statistically different from one series to another (p < 0.05). 4 For free sugars (% of energy), the averages are statistically different (p < 0.05) from one series to another except between “Complete Compliance with FC” and “Compliance with Observed Series”, and between “Complete Compliance with FC” and “Replacement of Meat and Fish with Other Dishes”.

