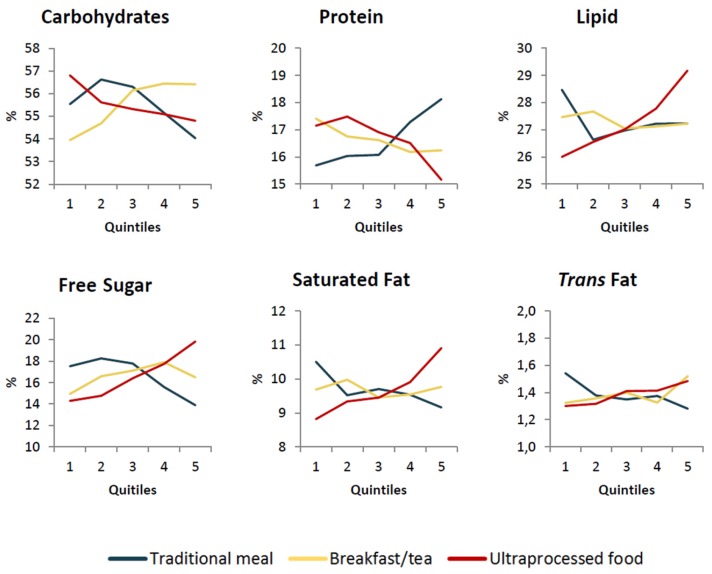
Figure 1.
Predicted values of carbohydrates, protein, lipid, free sugar, saturated fat and trans fat percentage according to fifths participation in eating out pattern scores, adjusted for personal, sociodemographic and socioeconomic characteristics and the percentage of calories consumed outside of the home. Brazilian population aged 10 and up (2008–2009).

