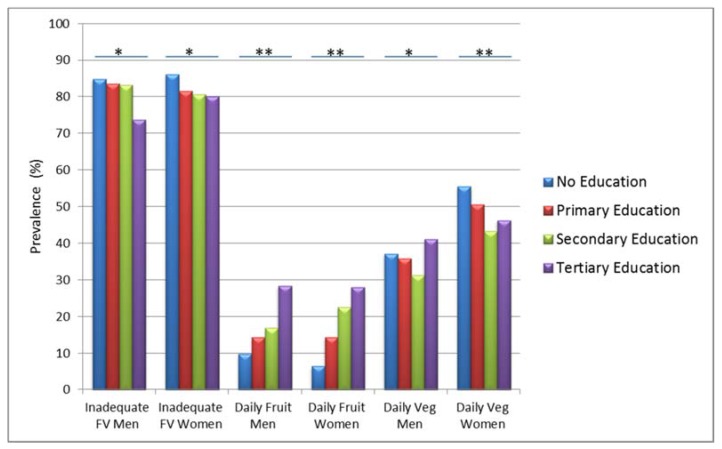
Figure 2.
Prevalence of daily fruit, daily vegetable and inadequate fruits and vegetables (FV) intake among men and women in different education categories (N = 7953). * Significant differences in fruit or vegetable intake across different educational levels (p < 0.05); ** Significant differences in fruit or vegetable intake across different educational levels (p < 0.0001).

