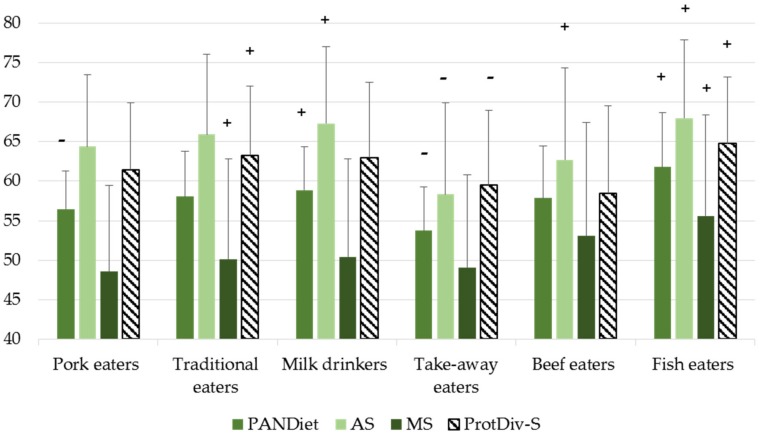
Figure 3.
PANDiet, AS, MS and ProtDiv-S of protein dietary patterns in INCA2 study (n = 1678). Only those patterns which differed significantly from those of the general population for at least one parameter are shown. Significant differences are represented with a “+” if the parameter in the cluster was higher than in the overall population, and a “-“ if the parameter in the cluster was lower. AS, Adequacy Subscore. MS, Moderation Subscore. ProtDiv-S, Protein Diversity Score.

