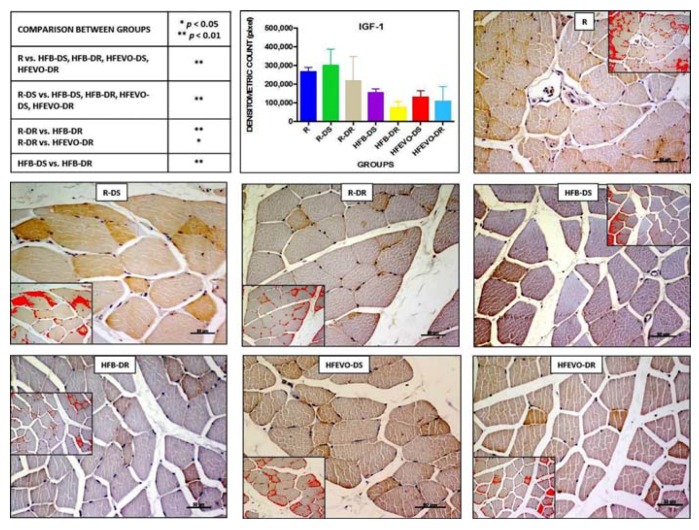
Figure 4.
IGF-1 immunostaining, image analysis by software in which the red color represents the immunolabelling (inserts), and a graph representing the intensity of immunostaining (densitometric count pixel2) with statistical analysis (p-values in the table). For details, see the text. The data are presented as mean ± SD. Scale bars: 50 µm.

