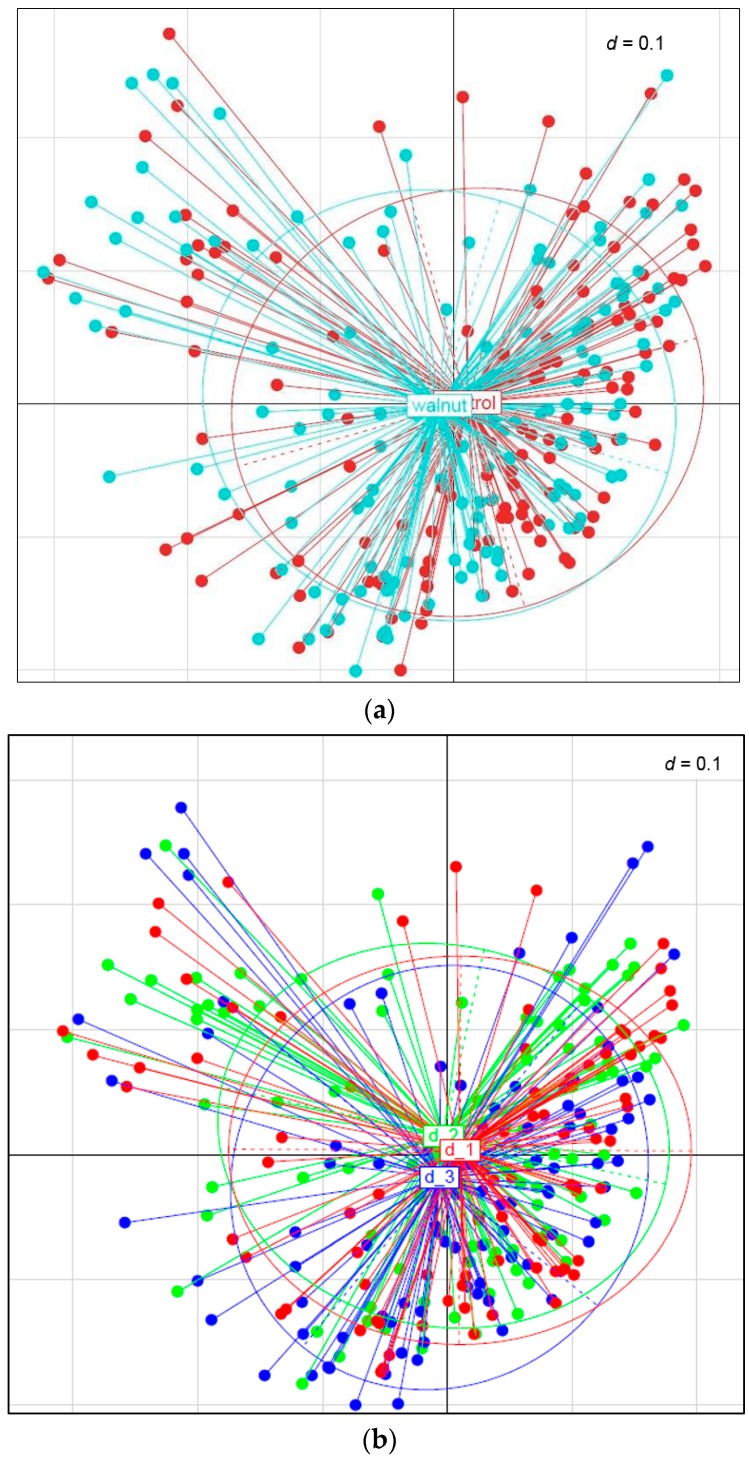
Figure 3.
(a) Beta-diversity between walnut and control diet. Distinct clustering was observed between the walnut and the control diet. By using generalized UniFrac distances considering the phylogenetic distance between Operational Taxonomic Units, MDS plot indicates significant dissimilarities of approximately 5% between walnut and control (p = 0.02). The multidimensional distance matrix in a space of two dimensions is visualized as MDS plot. Subject’s clustering and coloring were done according to the diet type. Each dot end indicates a sample position in the microbiota dataset (blue: walnut diet, red: control diet). (b) Beta-diversity between three different diet types during walnut consumption. Distinct clustering was observed between the diets. By using generalized UniFrac distances considering the phylogenetic distance between Operational Taxonomic Units, MDS plot indicates significant dissimilarities of approximately 5% between the different diets (p = 0.026). The multidimensional distance matrix in a space of two dimensions is visualized as MDS plot. Subject’s clustering and coloring were done according to the diet type. Each dot end indicates a sample position in the microbiota dataset (red: d_1: carbohydrate restriction; green: d_2: fat restriction; blue: d_3: both).

