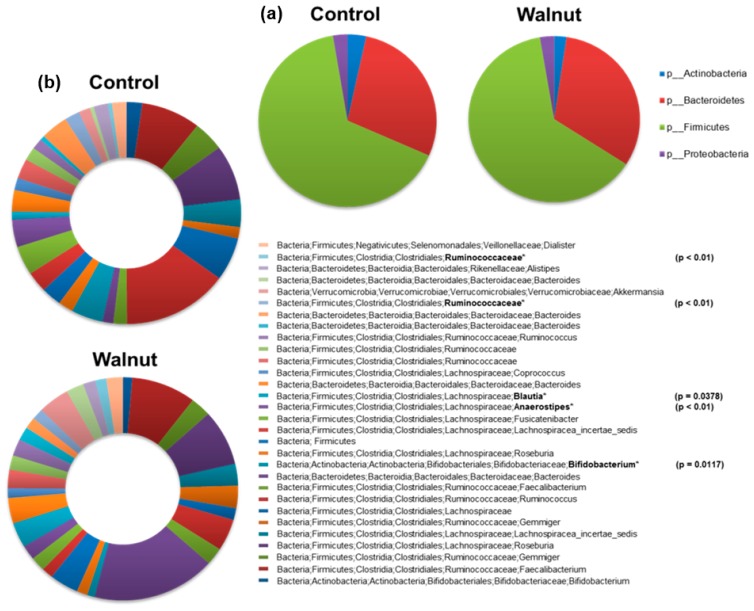
Figure 4.
(a) Relative abundance of the 4 dominating bacterial phyla between the walnut and the control diet. Walnut consumption shifted the predominant phyla from Firmicutes (61.2% after walnut consumption vs. 63.9% after control) to Bacteroidetes (30.8% vs. 27.4%). Relative abundance was calculated from the relative abundance of 16S rRNA gene sequences for each bacterial community by using the IMNGS platform. (b) Most abundant Operational Taxonomic Units for both walnut and control phase at genus level. Significant different OTUs are marked with by using * and p-values. p-values were calculated using a pairwise Fisher test.

