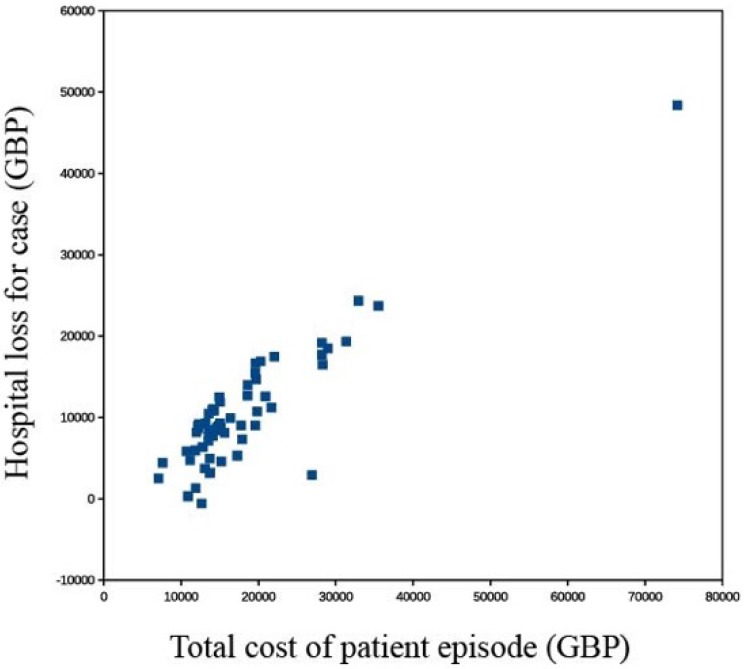
Figure 3.
Cost of patient episode compared to total loss to the hospital. Compared to total: The one patient who had a failed free flap and required another free flap is a gross outlier, it was the most expensive episode, just over £74 000 and had the highest deficit, more than £48 000. This scattergraph shows there is a correlation between the cost of an episode and the short fall in funding: more expensive episodes are more underfunded. One of the 60 episodes made a profit for the hospital.

