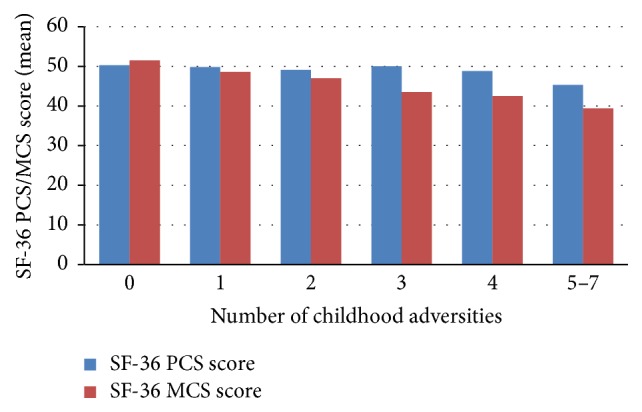
Figure 2.

SF-36 PCS and SF-36 MCS scores by number of childhood adversities. Note. There was a significant linear trend for SF-36 MCS score (ANOVA trend test; F = 77.2.9; p < 0.001), but not for SF-36 PCS score (ANOVA trend test; F = 2.2; p = 0.134).
