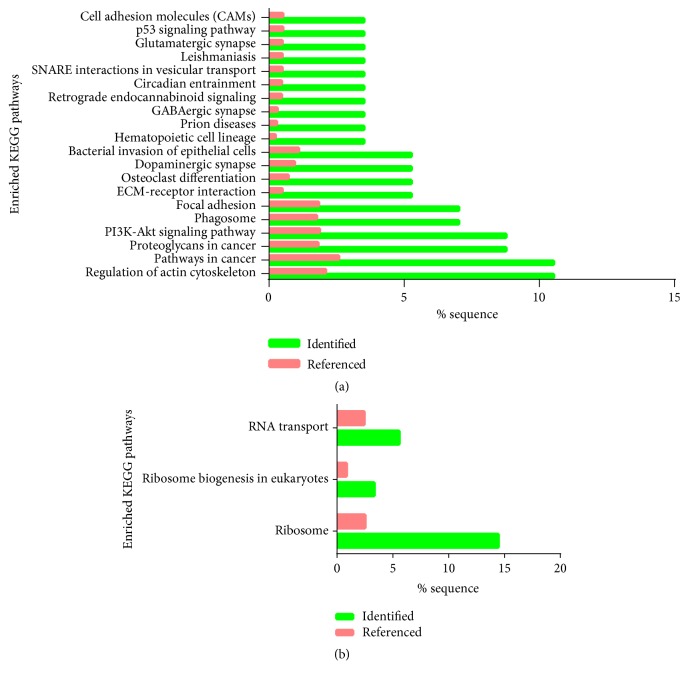
Figure 2.
Signaling pathway enrichment analysis of DEPs identified in this research. Significantly enriched KEGG terms of upregulated DEPs (a) and downregulated DEPs (b), identified bar represented the percentage of DEPs enriched in specific KEGG term, and the referenced bar represented the percentage of all identified proteins enriched in this KEGG term, which act as a control.

