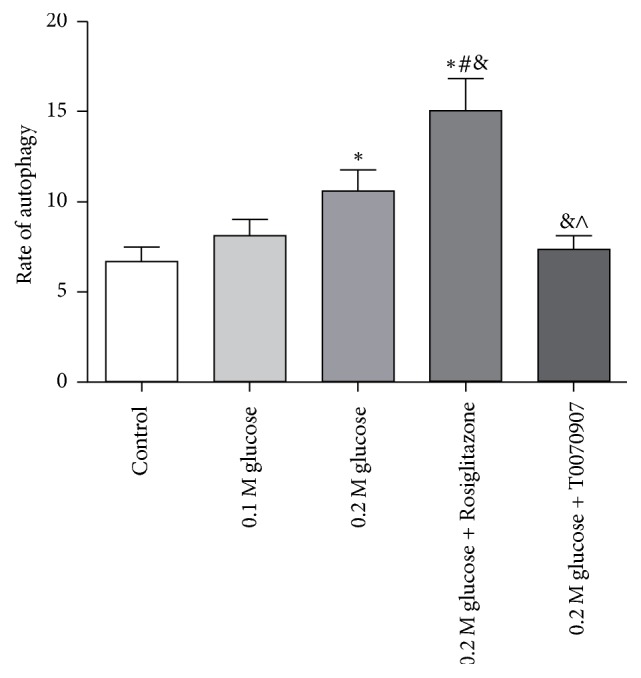
Figure 7.

The rate of autophagy under different medium conditions was shown and the PPARγ activation could induce autophagy significantly. ∗ represents a significant difference from the control group; # represents a significant difference from the 0.1 M glucose condition; & represents a significant difference from 0.2 M glucose condition; and ∧ represents a significant difference from 0.2 M high glucose condition plus agonist (p < .05).
