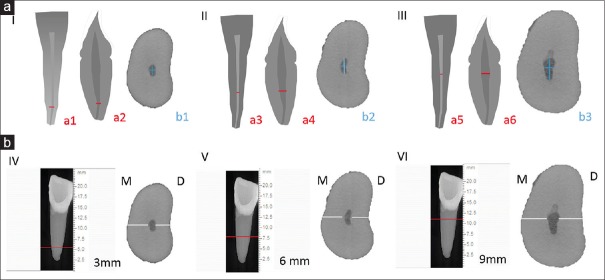
Figure 2.
(a) Diameter mesiodistal (a1, a3, a5) and buccolingual (a2, a4, a6) evaluated in radiographic images (red lines). Diameter ratio (b1, b2, b3) observed (blue lines) in micro CT images at 3 (I), 6 (II) e 9 (III) mm from the apex. (b) Images obtained using CTAn software and measurements of dentin thickness (white lines) of mesial (M) e distal (D) dentin walls at 3 (IV), 6 (V), and 9 (VI) mm from the apex. Different letters in each column indicate statistically significant differences (P < 0.05)

