Figure 2.

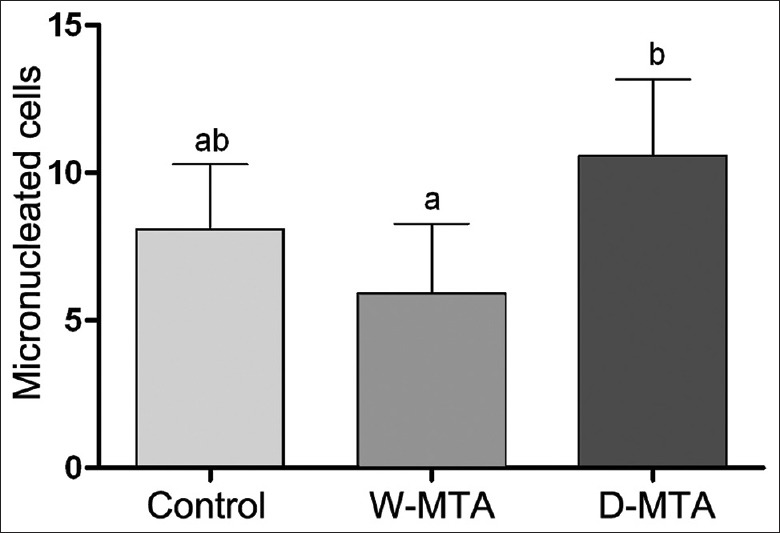
Micronucleus count in 2000 mouse fibroblast 3T3/NIH. Mean and standard deviation was based on at least three independent experiments. Different letters indicate statistical difference (P < 0.05)

Micronucleus count in 2000 mouse fibroblast 3T3/NIH. Mean and standard deviation was based on at least three independent experiments. Different letters indicate statistical difference (P < 0.05)