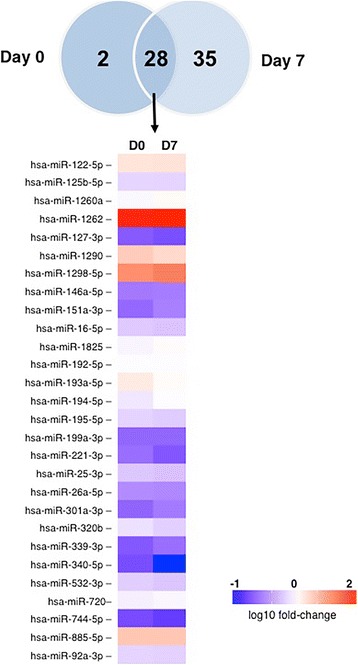
Fig. 1.

Exosomal RNA profile during sepsis. Venn diagram shows the number of microRNAs (miRs) from patients with sepsis at ICU admission (D0) and after 7 days (D7) as compared with those of healthy control subjects. The heat map illustrates the fold change profile of the 28 microRNAs differentially expressed at both time points
