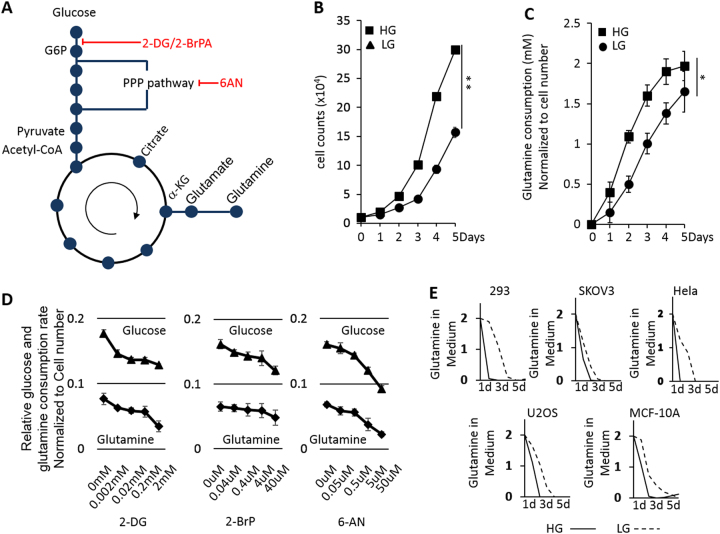
Fig. 1.
a The schematic illustration of glycolysis and glutaminolysis pathways interconnected by TCA cycle in proliferation cells. b Growth curve of MCF-7 cells in both high glucose (HG) and low glucose (LG) conditions. c Glutamine consumption measurement of MCF-7 cells under HG and LG culture conditions. d Glucose and glutamine consumption rate measurement in MCF-7 cells treated with glycolysis inhibitors 2-DG, 3-BP, and 6-AN with increased dosage. To ensure the comparability, the cell number for each condition are the same. e Glutamine consumption rate in different cell lines culturing in HG (solid line) or LG (dashed line) conditions. Initial glutamine is 2 mM. The error bars represent the SD of three independent replicates. *p < 0.05, **p < 0.01

