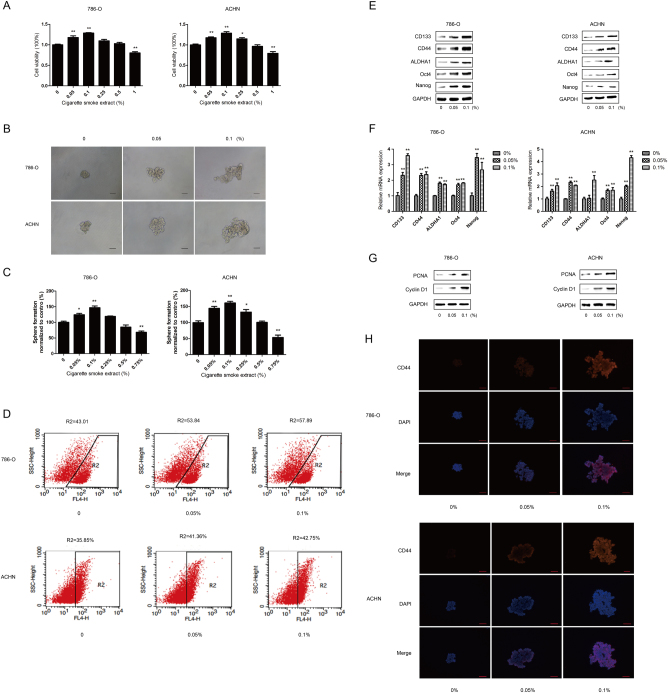
Fig. 2. CSE promotes the characteristics of renal CSCs.
Different concentrations of CSE were added to 786-O and ACHN tumorspheres for 5 days. a Cell viability was examined by CCK-8 assay. b The representative images of 786-O and ACHN sphere-forming cells were obtained. Bar, 100 μm. c The number of tumorspheres was counted and normalized to the control group. d Percentage of CD133+ cells after CSE treatment for 5 days. e Western blotting and f qRT-PCR were used to analyze protein and mRNA levels of renal CSCs markers. g Expression of cell proliferation associated protein was determined by western blotting. h Immunofluorescent staining of CD44 in 786-O and ACHN spheroids. Bar, 100 μm. Data are expressed as mean ± SD. *p < 0.05, **p < 0.01 compared with control

