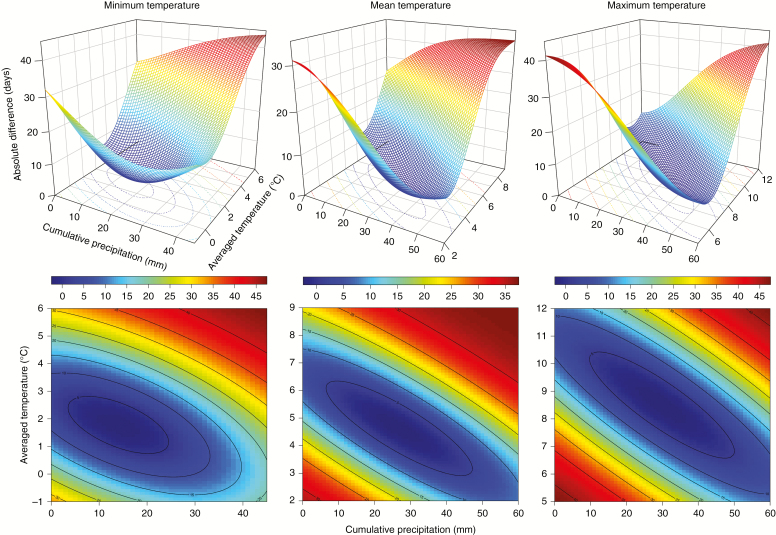
Fig. 3.
Surface plots and the corresponding level sets showing the two-dimensional Gaussian distribution of the absolute difference between the observed day of onset of xylogenesis and the estimated day with a given average temperature and cumulative precipitation in the time window of 12 d. Note that the axes have different scales.

